


DAF is a leading Dutch truck manufacturer with a strong focus on innovation and efficiency. During my graduation internship, I worked on the redesign of an internal diagnostic system used by technicians at DAF dealerships.
The goal of this project was to streamline the diagnostic process and significantly reduce the time required to access vehicle data. Previously, technicians had to manually connect a laptop to each truck in order to retrieve diagnostic information. With the new design, real-time data is displayed automatically—eliminating the need for manual connection and saving approximately 30 minutes per session.
Over a period of six months, I developed a user-centered design for both desktop and tablet use. The interface focuses on clarity, speed, and ease of use, aligning with DAF’s core values: reliability, innovation, and efficiency. The result is a modern, intuitive system that supports technicians in working faster and smarter on the workshop floor.
1. Homepage
The image below shows the start signal used by technicians to visually display error codes in a truck. At the bottom, you can see the 'DTCs' (Diagnostic Trouble Codes), which represent these error codes. The information associated with each error code is recorded by DAF and is displayed below the DTC. In the next screen, it is shown how technicians can visualize the error codes for easier diagnostics

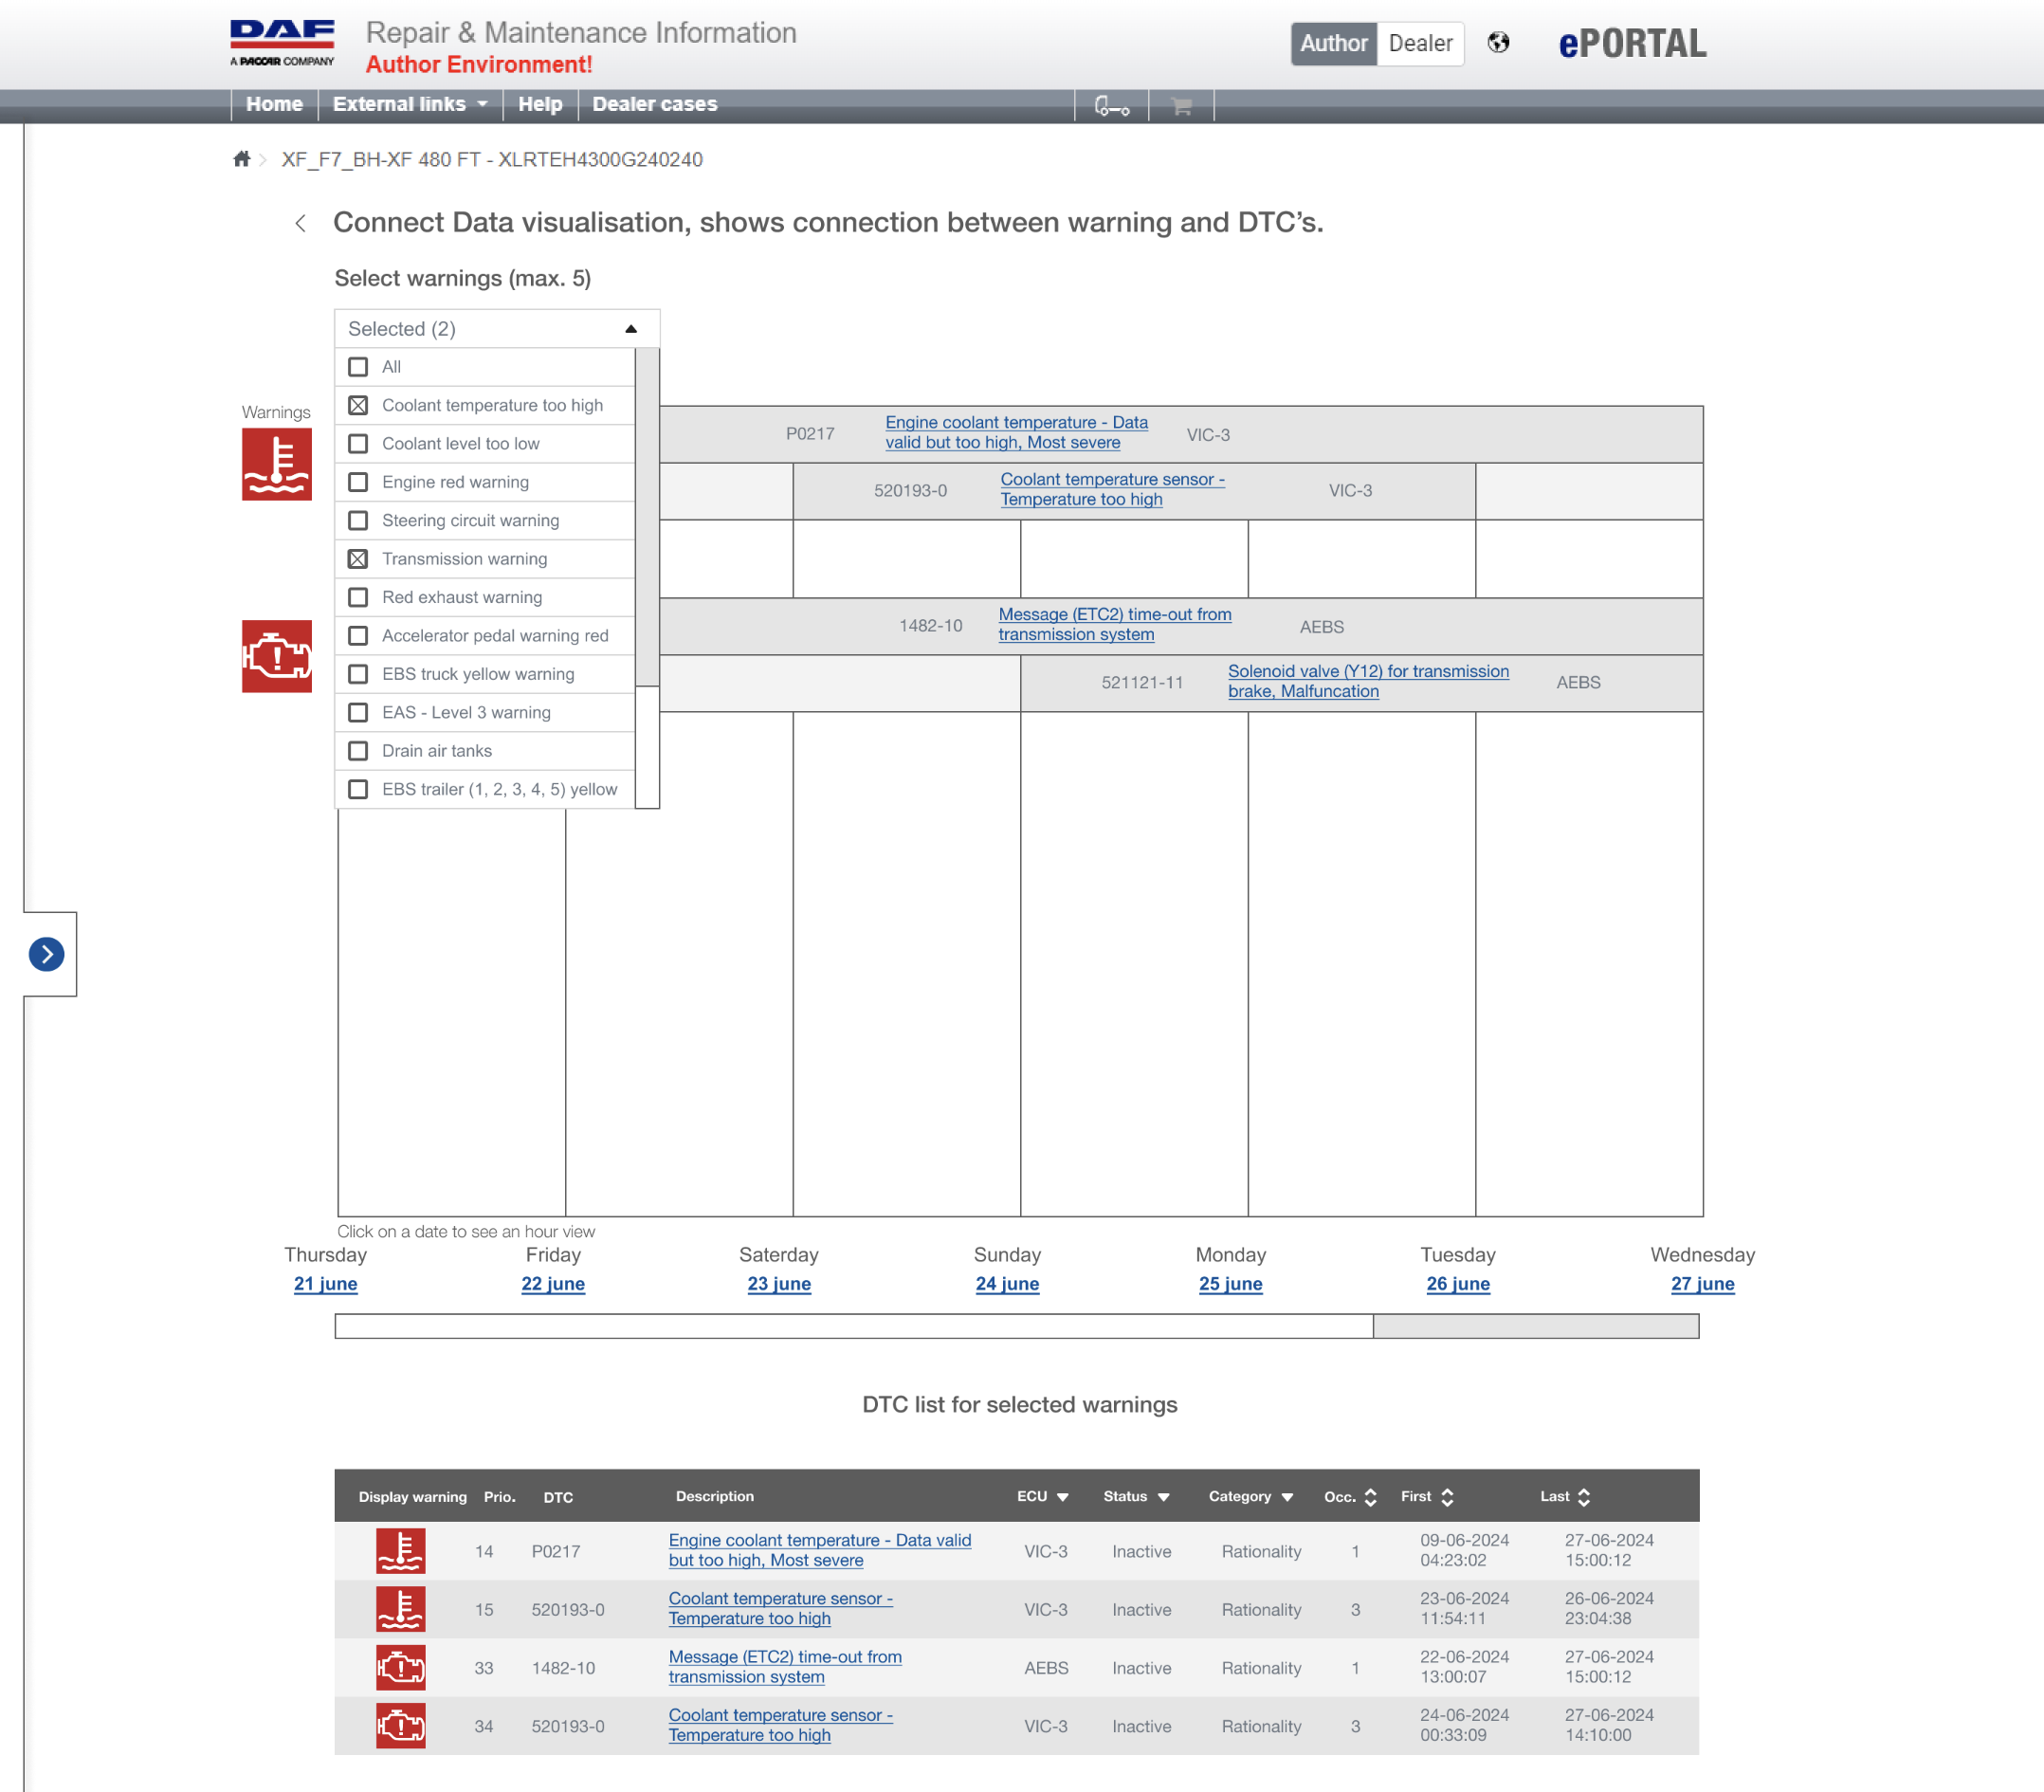
2. Selecting error codes
This image shows how technicians can select error codes using a dropdown menu. The icons on the left represent the warnings linked to each error code. Every error code is associated with a specific warning, which appears on the truck's display. For example, there are two error codes in this truck related to the coolant warning.
3. Information error code
When a technician clicks on an error code within the visualization, the menu below appears. In this menu, technicians can view all the data related to the selected error code. This information is essential for understanding the nature of the fault. They can also see Freeze Frame data, which shows how the error developed over time in relation to parameters such as vehicle speed.

4. Freeze Frame graph
The image below shows the graphs technicians can view related to the Freeze Frame data. In this visualization, you can see the vehicle speed at the moment the error code occurred, as well as 5 and 10 seconds before and after the event. Technicians can select multiple error codes at once. This information helps them identify patterns and correlations between different faults.

5. Zooming in on date
If technicians want more insight into the error codes, they can click on a date on the homepage. Once a date is selected, the visualization zooms in to an hourly view. In this detailed view, technicians can see exactly when an error code was activated and deactivated. Since a fault code can switch on and off multiple times per minute, it's important for technicians to understand this timing in order to properly analyze when and how the issue occurred.
They can also hover over a red area in the graph to reveal guide lines, helping them pinpoint the exact time the error code was deactivated. A red area indicates that the fault code was not active during that period.

6. Zooming in on hourly view
From the hourly view, technicians can click on a specific time to zoom in further to the minute level. This allows them to see whether a fault code occurred repeatedly in a short period. Such detailed insight helps reveal patterns and correlations that would otherwise remain hidden.

2025 Kim Oppers